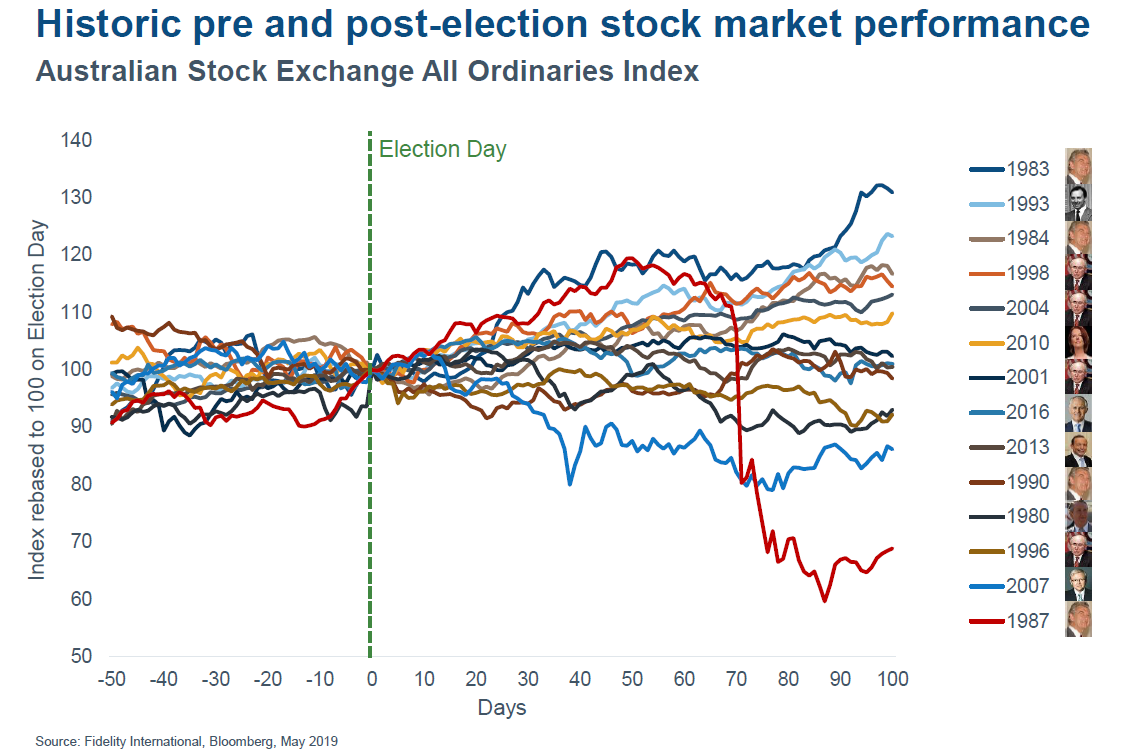
Anecdotes suggest that uncertainty around an Australian Federal election can result in households and businesses delaying important spending decisions. When it comes to the Australian equity market, returns in the run-up to election day have been relatively stable. For example, since 1980 there have been 14 Federal elections. Interestingly, in the 50 days leading up to each election, equity market returns have generally moved between a narrow +/- 10% band. However, in the 100 days that followed each election result, the Australian Stock Exchange All Ordinaries Index has posted very different return outcomes. If we look at 1983, the equity market was up 31% following the election of the Hawke Labor government. In contrast, in 1987 the Australian equity market posted a -31% loss following the election of the Hawke Labor government, a period that encompassed Black Monday and the 1987 global equity market crash.
Based on the last 14 Australian Federal elections, there is no clear winner regarding which political party is better for equity markets. Given the global nature of financial markets, international developments will likely be the bigger driver of returns for the Australian market in the short term.