Today’s news headlines scream about a world of almost unprecedented political and economic policy uncertainty, yet measures of equity volatility are falling. How do we explain this inconsistency?
Part of the problem is that current measures of market volatility are poor indicators of risk. Worse still, periods of low volatility can lull investors into a sense of complacency which tends to fuel consensus portfolio positioning. This creates a feedback loop of trending markets, lower volatility and building risk of a sharp change in sentiment.
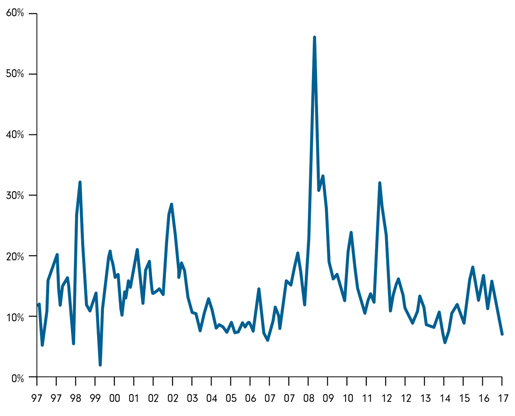
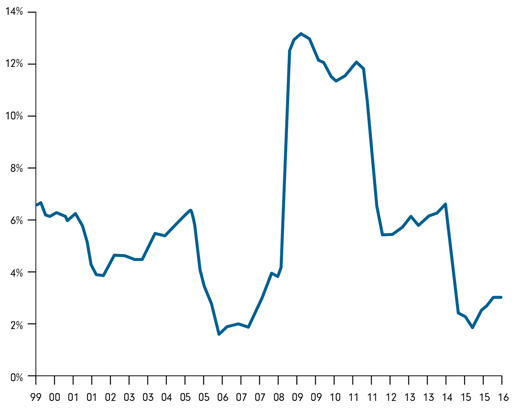
For the last four years, this pattern has been accentuated by central bank monetary policy. Exceptionally low interest rates and asset purchases have forced investors into riskier assets, driving up prices and dampening volatility. In fact, the volatility of realised equity volatility* is not far from the all-time lows set in 2006/07 (see chart below). But sporadic surprises have triggered acute drawdowns, demonstrating the latent risk in today’s environment.
Chart 1: The volatility of equity returns is falling
Chart 2: The volatility of realised equity volatility* is near all-time lows
Source: Fidelity International, DataStream. 31/01/2017. * Based on 3 year volatility of annualised 90 day volatility using daily total returns for the MSCI World index.
"Higher volatility need not be bad news. it increases the alpha opportunity for active managers" George Efstahopoulos
But the winds of change are blowing. The US Fed has started to tighten monetary policy and the European Central Bank and Bank of Japan have altered their tactics, after recognising the limitations of negative interest rates and never-ending QE. Sure there is still a lot of QE to be done. But investors can no longer anticipate an automatic response from the central banks to back-stop economies and markets with additional monetary policy support when things go bad.
Can the ‘central bank put’ be replaced by a ‘fiscal policy put’? Perhaps the recent fall in equity volatility and the dominance of positioning portfolios for faster economic growth and higher inflation is evidence it can.
But you don’t have to scratch too far under the surface to see that the effect of fiscal policy is different. Firstly, there’s been a large rotation within the equity market since the start of November, away from defensive bond proxy stocks and into traditionally higher-volatility cyclical stocks. Low- risk factor investing has delivered more volatile portfolios than quality, growth and value factors over the same period. Single stock volatility has increased. And volatility is on the rise in other asset classes, especially core government bonds and currency markets.
Expect equity volatility to begin trending towards higher levels, with potentially larger price swings around some of the key risk events coming up compared to the recent past.
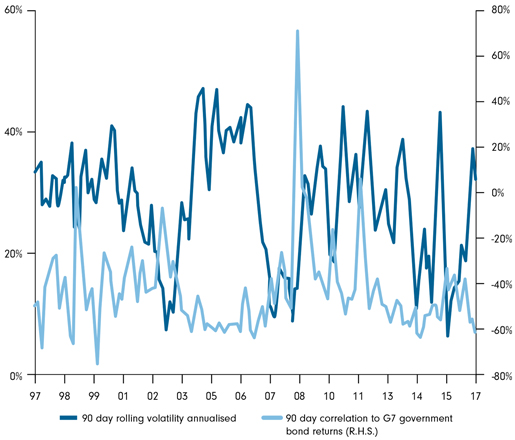
This need not be bad news. Fundamental factors should become more of an important driver of returns without so much of the distorting impact of QE. Higher volatility and a move away from ‘risk on, risk off’ markets should help portfolio diversification. The correlation between equities and high quality bonds tends to be lower when equity volatility is higher. Both are better for efficient asset allocation.
Higher volatility and lower correlations also increase the alpha opportunity for those active managers skilled and dynamic enough to capture it. This will be important in a world where expected returns remain low, inflation is rising and permanent protection against downside risk is expensive.
Chart 3: The inverse relationship between equity volatility and equity/bond correlation
Source: Fidelity International, Datastream. 31/01/2017. Based on the annualised 90 day volatility of daily total returns for the MSCI World index. Government bonds returns based on Bank of America Merrill Lynch G7 government index


