Download pdf
I have just returned from Fidelity’s annual bespoke Silicon Valley bus tour, where the team has spent time with 26 companies and their top management. Despite all the market noise around the recent NASDAQ sell off, this trip has provided confirmation that the pace of innovation coming out of this part of the world is unlikely to let up. A lot of private capital continues to chase start-ups that are leading disruption, and our analysts will no doubt be keeping a firm eye on the evolving landscape.
While our meetings highlighted a lot of interesting stuff going on in the Valley, I have come back feeling that much of this is now known and the information we have gained has been incremental. The one big takeaway, however, is how much of the capital expenditure (capex) spend on technology is actually being driven by technology businesses themselves.
A back of the envelope calculation of the cash discretionary outlay (capex + Research & Development (R&D) spend) of the Top 5 technology players (Apple, Google, Facebook, Amazon, Microsoft) paints a very interesting picture. This figure has increased from roughly USD 36 billion in 2011 to USD 125 billion in 2017 and is now on track to reach about USD 200 billion by the end of 2018. This means that while revenues for such companies over that period have doubled, capital expenditure has actually gone up by close to four times! This could have some important implications for the sector overall and we’ll be spending time in the weeks ahead looking at a number of different scenarios.
Chart 1: Cash discretionary outlay: Top five tech companies
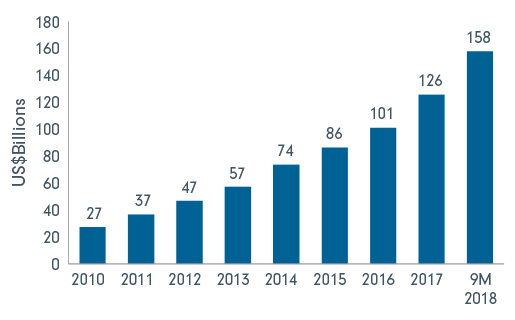
Source: Fidelity International, Bloomberg. Data as at 08 November 2018
Let us start with the rosiest of the scenarios: that this capex + R&D spend leads advances around machine learning /cloud computing etc resulting in companies reaping the benefits in terms of revenue growth for a long time to come. However, if this is the case, then capex to sales will have to normalise for these large businesses in the future, something we have recently seen with Apple. This could potentially be negative for the supply chain and could be what the market is starting to discount with semiconductor stocks this year. In this scenario, large caps may look even better than the market suspects as their Free Cash Flow (FCF) yields could get better.
The second scenario (my base case at this point), which is a little less rosy for the large caps, is that the high levels of capex are now just part of the normal cost of doing business in this space. This means that incremental and reported Return on Invested Capital (ROIC) of the Top 5 technology companies will continue to come down. If this is the case, then potentially the market has yet to fully penalise the large caps for poorer fundamentals. However, on the flip side, the rest of the value chain could be well better protected than the market believes.
Chart 2: Cash discretionary outlay-to-sales:
US tech vs. S&P 500
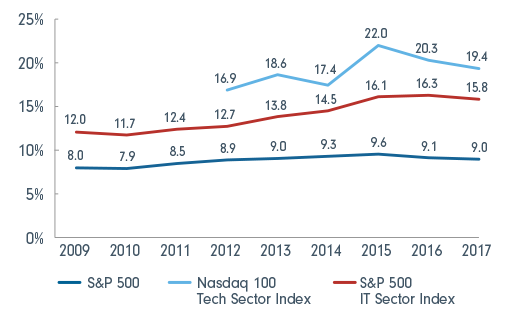
Source: Fidelity International, Bloomberg. Data as at 08 November 2018
The most bearish scenario of course is that the cloud/machine learning background is to 2018 what the bandwidth build out was to 2000. The market is not spending much time thinking about this but I do think it is worth asking the question: is there really some holy grail behind all this machine learning/cloud investments driving incremental revenue growth? In other words, did Alphabet really need to increase computer power three-fold for its autocomplete in Search to work? Was it innovation for higher ROICs or innovation for innovation’s sake? As we head towards the later stages of the cycle, the chances of utopian visions meeting a business recession could get painful.
I am quite early in my thinking on this topic, so these views are not a clarion call but more a gentle nudge to think beyond the hype and focus in on fundamentals.