Fidelity’s Global Equities Portfolio Managers met recently for their quarterly review covering macro, markets and stocks. As part of the process, they discussed what has been driving markets, and the outlook for the coming quarters. Here are some of the key observations.
Given the dramatic move in US Treasury yields over the past four quarters (with the 10-year falling from 2.6% to a low of 1.5%), and the long-awaited inversion of the US yield curve, we began with a look at the broader macro outlook. Global leading indicators are still falling (Figure 1), particularly in the US and Germany, but show signs of stabilisation elsewhere, notably China. This mirrors the commentary we have been hearing from companies, that activity in China and Europe may be bottoming out, while the US appears to be deteriorating.
Global leading indicators are still falling, particularly in the US and Germany, but show signs of stabilisation elsewhere, notably China.
Figure 1: OECD leading indicators
Source: Bloomberg, Fidelity International, September 2019.
China’s potential recovery is significant in a global context: the rebound we have seen year to date (YTD) in China’s credit impulse (a measure of credit availability, Figure 2) has typically led global PMIs by 12 months, suggesting we may see an improvement in global growth as we head into 2020. The big caveat here is the trade war – we believe that the scope of tariffs has widened of late. We are yet to see the introduction of ‘soft tariffs’, such as a government-sponsored Chinese boycott of US goods, which could threaten to derail the growth recovery before it even starts.
Figure 2: China credit impulse vs global manufacturing PMI
Source: PBoC, JPM/Markit; Haver Analytics. Fidelity International, September 2019.
With memories of the global financial crisis still relatively fresh in the memory of most market participants, a lot of attention gets paid to the yield curve and the recession probability indicators produced by many strategists. These are certainly flashing amber right now, if not red. However, it can be easy to forget that recessions come in several flavours – the vast majority of which are not as severe as 2008/09. We believe there is a good case to be made that the next few years may resemble Japan in the 1990s, a decade of gentle slowdowns met with stimulus, rather than severe economic crashes. We don’t yet see the egregious excesses that are usually a precondition for more severe corrections, such as the subprime market that grew tenfold in the run to the global financial crisis, although there are certainly areas of concern, such as the leveraged loans market, that require close monitoring.
Figure 3: US yield curves
Source: Bloomberg, Fidelity International, September 2019.
Figure 4: Probability of US recession index
Source: NY Fed, Bloomberg, Fidelity International, September 2019. NY Fed Prob of Recession in US Twelve Months Ahead Predicted by Treasury Spread.
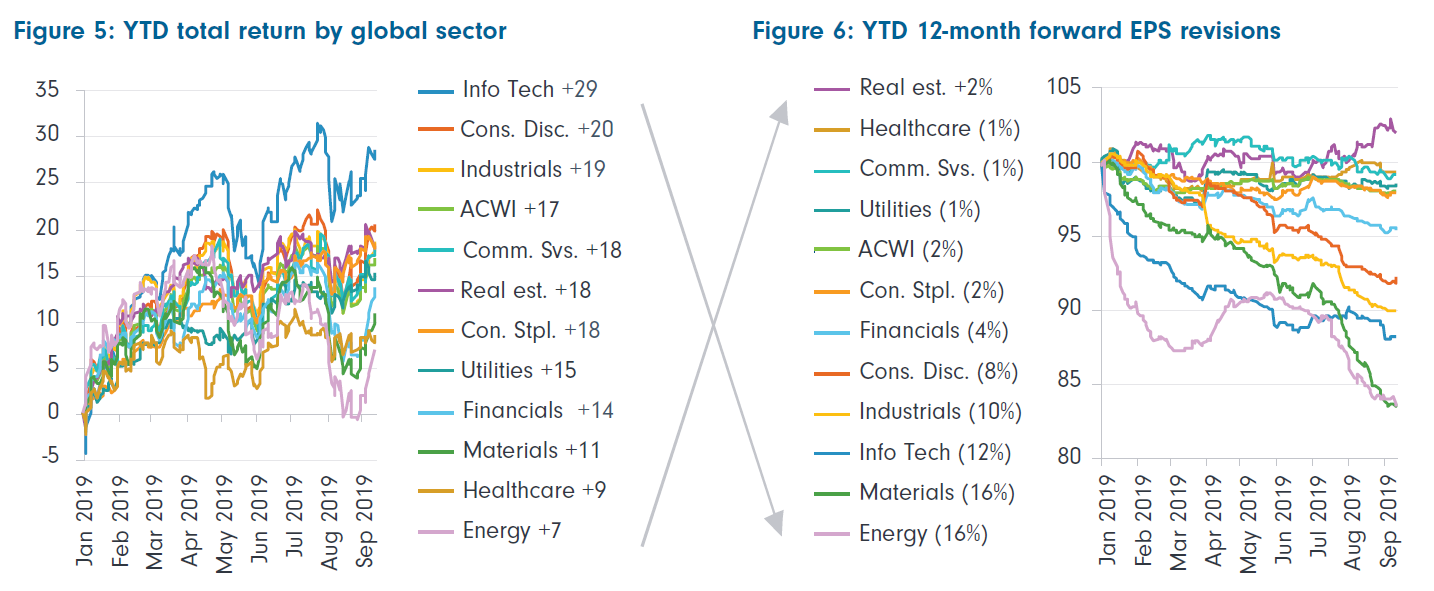
By sector, technology continues to be the stand-out performer YTD with a 29% total return vs the 17% for broader index. All of that outperformance came in the first quarter of the year since when the sector performance spread has been much narrower, with the exception of financials that have, unsurprisingly, lagged given the move lower in bond yields. Interestingly, unlike previous quarters, we noticed an interesting divergence between YTD total return and earnings revisions – despite being the best performer, information technology has seen the third-worst earnings revisions YTD, while health care, the second worst YTD performer, has seen the second-best revisions. This serves to illustrate that stock picking is as much art (calling sentiment, politics, etc.) as science (forecasting earnings trajectory).
Source: Bloomberg, Fidelity International, September 2019.
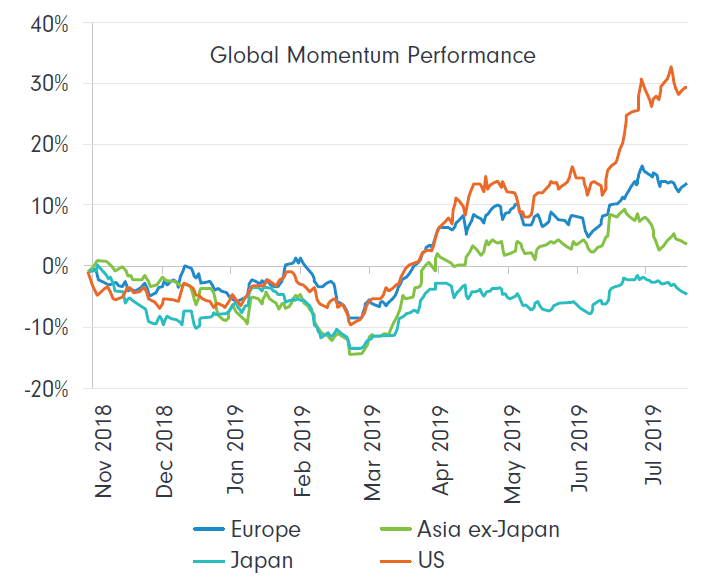
Quality and momentum factors continued to dominate market leadership, while high-beta stocks fell to record relative discounts. The team noted the stretched nature of some of these indications, which proved to be a particularly timely discussion considering the recent and dramatic shift in leadership toward value stocks and performance laggards (Figure 7). If improving Chinese macro data does indeed drive a reacceleration of global growth in 2020, we could see this trade continue, with markets moving back into risk-on territory that traditionally favours value stocks.
Figure 7: Is momentum losing momentum?
Source: Morgan Stanley, Fidelity International, September 2019.
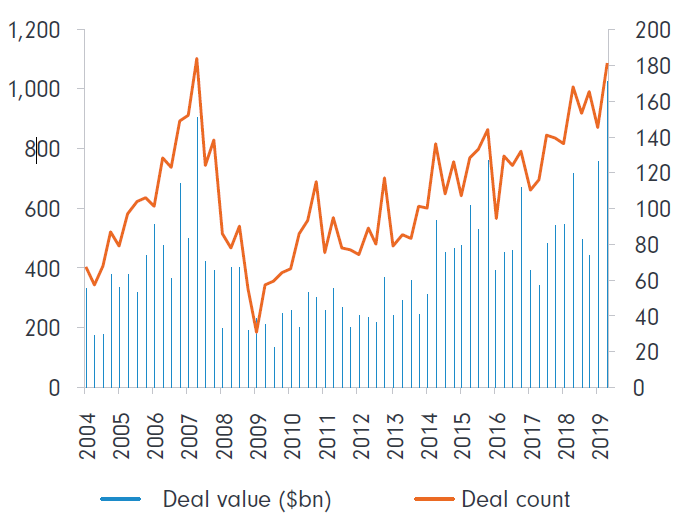
M&A was another prevalent feature of Q2, with the highest quarterly announced or proposed deal value on record (Figure 8). While strategic buyers still dominate, financial buyers are becoming more active, perhaps linked to the record amount of committed but uninvested capital under the control of private equity firms looking for deployment. The UK also saw a large tick-up in M&A, with buyers seemingly looking to exploit lowly equity and currency valuations as a result of the uncertainty surrounding Brexit.
Figure 8: Record M&A volumes
Source: Bloomberg, includes all announced and proposed deals > US$1 billion. Fidelity International, September 2019.
Where are we looking for opportunities?
As ever, we continue to search for stocks where we have high conviction in the fundamental outlook and an attractive valuation, a group that is becoming ever harder to find and trading at ever greater premia to the market. We will continue to apply strict valuation criteria and remain highly selective in this area.
The recent pullback in some of these more highly rated stocks may create opportunities to buy attractive businesses that, until now, have not been able to meet such criteria. We also continue to search for stocks offering compelling value, particularly among cyclical industries that are frequently trading at very depressed valuations on through-cycle measures, such as Price to Book, despite the potential for an improving outlook in 2020, as discussed above.
Global leading indicators are still falling, particularly in the US and Germany, but show signs of stabilisation elsewhere, notably China.
.PNG)
.PNG)
.PNG)
.PNG)


