Bank blow-ups and tight labour markets make a hard day's night for the Fed
While US bank failures have been dominating the news, the scorching labour market is a reminder that the US Federal Reserve’s (Fed) fight to tame inflation is far from over. This week’s Chart Room looks at a proprietary indicator that shows how the Fed’s rate hikes have so far barely made a dent in historic levels of labour market tightness.
Fed chair Jerome Powell is spoiled for choice when it comes to problems to lose sleep over. Prior to last week, it was persistent inflation and the resurgent jobs market data that seemed most vexing. That changed on 12 March, when the Fed and other US policymakers announced emergency measures to avert a snowballing crisis after the sudden failure of Silicon Valley Bank (SVB).
This week’s Chart Room looks at the tightrope the Fed must now tread between preserving financial stability on one side and continuing the fight against inflation on the other, seen through the lens of the tenaciously tight labour market.
In a sense, SVB’s demise is evidence that the Fed’s year-long campaign of raising interest rates is indeed starting to produce the desired tightening of financial conditions. Bank failures are an unintended by-product of this tightening. But in another sense, the rate hikes still don’t appear to have hit the mark, as seen in the latest inflation and jobs market data.
Headline consumer price index inflation eased in February, down to 6 per cent year-on-year from January’s 6.4 per cent, data released March 14 showed. Core inflation, which strips out food and energy prices, was 5.5 per cent in the year to February, barely changed from January’s 5.6 per cent number. Inflation, in short, is still far above the Fed’s target rate.
What else keeps Powell up at night?
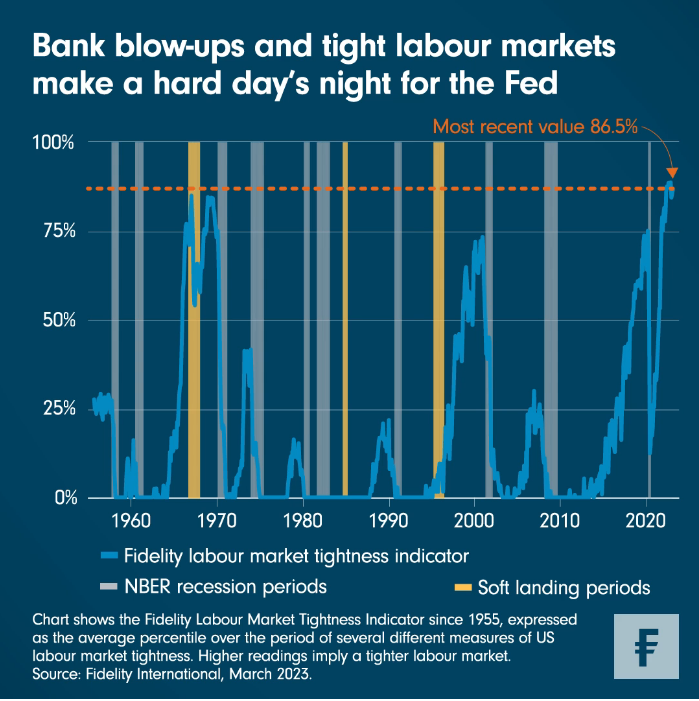
Before last weekend’s fireworks over SVB, the “extremely tight” nature of the US labour market was arguably foremost in Powell’s mind, judging by his testimony to Congress earlier this month. But how tight is “extremely tight”? This week’s chart highlights the Fidelity Labour Market Tightness Indicator (FLMTI), affectionately known as the ‘Flumpty’, a metric that enables us to take a quantitative view of a phenomenon usually discussed in abstract terms.
The FLMTI, which hit a seven-decade high in September and remains near historical highs, captures the average percentile of nine different labour market tightness measures, including the unemployment rate, the jobs-to-workers gap and the quits-to-hires ratio. The tighter the US jobs market is by historical standards, the higher the reading.
While the SVB failure may have highlighted the risks tightening poses to financial stability, the latest readings of the FLMTI suggest the Fed has little room for reversal unless and until it can show its policy is beginning to have traction on the labour market.
How will the Flumpty fall?
As can be seen in the chart, there has never been a soft landing (a hiking cycle that doesn’t end in recession) with this amount of labour market tightness. Combining this context with the largest hiking cycle since the 1980s is why our base case for the US economy has been a hard landing for some time now.
So far, we have been expecting a cyclical recession, a scenario in which the unemployment rate rises by up to 3 percentage points. But in the context of SVB’s collapse, and the spectre of more banks potentially failing, it is now less clear whether the US economy can avoid a more severe contraction - what we call a balance sheet recession. Either way, the most likely outcome from here is that, sooner or later, the Flumpty will have a great fall.