|
Markets globally have recovered since the height of the Covid-19 crisis, driven largely by monetary and fiscal stimulus. However, the headline rebound conceals a mixed picture that includes sectors entirely unaffected, those in recovery and those fighting for survival.
Countries too have seen different outcomes: The S&P 500 is up 10 per cent, the Chinese market is up c. 20 per cent (in dollar terms), while the UK is down 20 per cent and Europe down 12 per cent (in local currency terms).
Fiscal policy expectations, and how the US election outcome shapes them, will significantly influence sentiment in the final quarter of this extraordinary year, and volatility could remain elevated. But beneath the noise, longer-term opportunities continue to emerge across a range of sectors and regions.
Market conditions and participant types have shifted since March
When the Covid-19 crisis hit back in March - followed swiftly by an oil shock - bid/offer spreads widened across fixed income and equity markets. In the wake of the huge monetary and fiscal response, overall credit market spreads in the US have tightened to near pre-Covid levels. In some areas (such as telecoms and healthcare), they are even tighter than before the pandemic; in others (such as energy), they remain wider, making it important to select sectors carefully and trade patiently and nimbly to keep transaction costs low. Meanwhile, a wall of cash has flowed into money markets and fixed income, driven in part by central banks acting as buyers of last resort.
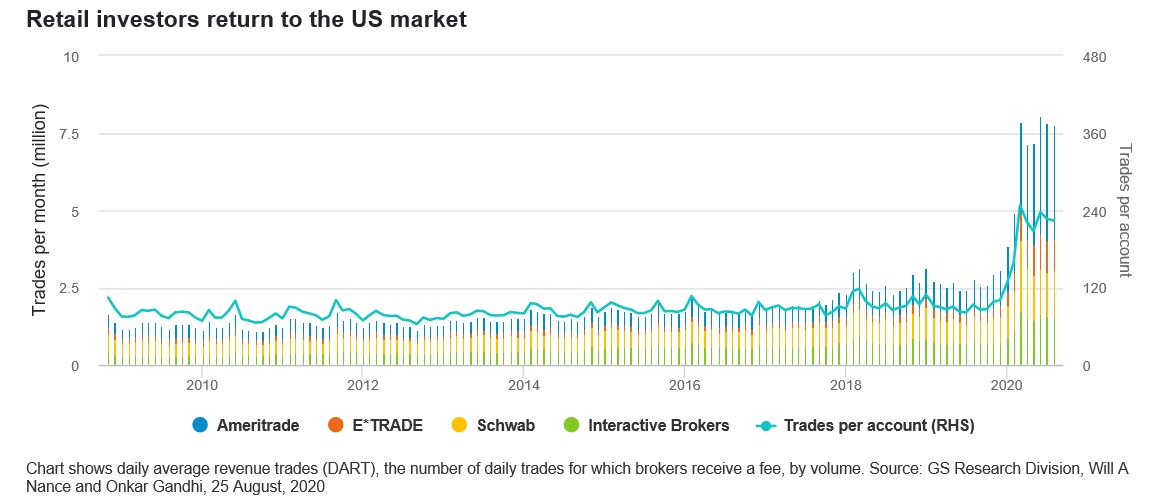
In equity markets too, overall, share prices have rebounded, though not to pre-Covid levels. In the past, share prices were often buoyed by large share buyback programmes. These have dropped from between $700bn to $900bn over the last three years to c.$200bn this year thus far. Companies are now issuing large volumes of shares (the US market had its busiest IPO season in Q3 since the dotcom boom) as well as debt, primarily to prop up balance sheets but also to invest in new areas. With the corporate buybacks of shares all but gone from the market, non-US institutions, some central banks and resurgent US retail investors are making up a greater proportion of trading activity.
On the retail side, broker accounts have increased by around 18 per cent in 2020. August was one of the busiest months on record for retail trading activity. The latter accounted for between a fifth and a quarter of overall market volumes, which were seasonally a bit lower, increasing the impact of retail trades.
Online balances for three of the largest brokers (excluding Robinhood) are around $66bn, up from $46bn in March[1]. Day traders, who normally just provide liquidity to the market, have been buying too. Nonetheless, equity bid/offer spreads remain higher than before Covid and flows have been net negative this year. Some areas, however, such as Japanese, international and tech funds have had strong flows.
This reflects an even narrower market leadership this year than last, especially among the mega cap tech stocks which now account for almost a quarter of the S&P 500 index in terms of market cap. At a stock level, however, the story is more nuanced. There are three distinct tiers of companies following the Covid crisis. The first is those for whom lockdowns have been a non-event or have had a constructive business impact. Second are those in cyclical recovery such as industrials and technology subsectors, and the third tier consists of those that are effectively closed due to the pandemic (travel and leisure) or are facing long-term structural challenges, such as ‘bricks and mortar’ retail, banks and oil companies.
Higher levels of volatility could be the new normal
Given this sector divergence and the uncertainty over the virus’s trajectory, market volatility remains understandably higher than in 2019 - though nowhere near the highs of spring 2020. One could argue that recent periods of calm such as 2017 and 2019 were in themselves unusual, and in fact we are returning to more ‘normal’ market conditions. This may not be a bad thing as it allows for a more realistic, perhaps more sustainable, pricing of risk.
Fiscal policy matters for market direction and economic recovery
Key to market direction in Q4 2020, and the size of the economic recovery in 2021, will be how far fiscal policy picks up the baton from monetary policy. Investors have been hoping for the best. They have been looking through the short-term challenges of reaching a deal on fiscal spending in the US prior to the election, and pricing in a substantial level of fiscal stimulus to come, perhaps as soon as the election result is known.
But it may not be known for some time. The size of the fiscal stimulus may also depend on which election scenario plays out. For example, a Democratic sweep could bring stimulus at the higher end of a $1-$3 trillion range, possibly more, if Joe Biden were to implement a national green infrastructure spending plan. On the other hand, if the Democrats take the Presidency but not the Senate, there could be gridlock for example over the new President’s choice of Treasury Secretary, and the size of the eventual package could be closer to $1 trillion.
Impact on yields will be limited, as Fed put remains in place
Even at the higher end of the stimulus scale, the impact of the fresh government bond supply (required to fund it) on yields should be limited. The US Treasury already holds around $1.7 trillion of reserves at the Federal Reserve, which it could draw down to finance fiscal spending. In normal times, such reserves sit at around $300bn. If this happened, there would be less need for large volumes of additional issuance. If issuance did pick up, however, we estimate it would have a limited absolute impact of around 25 basis points on the 10-year Treasury yield, which currently yields around 75 basis points. Unless a Democrat win dramatically increased government spending plans beyond what has been signalled, we believe that stabilisation in growth is likely to have more impact on yields than additional bond supply.
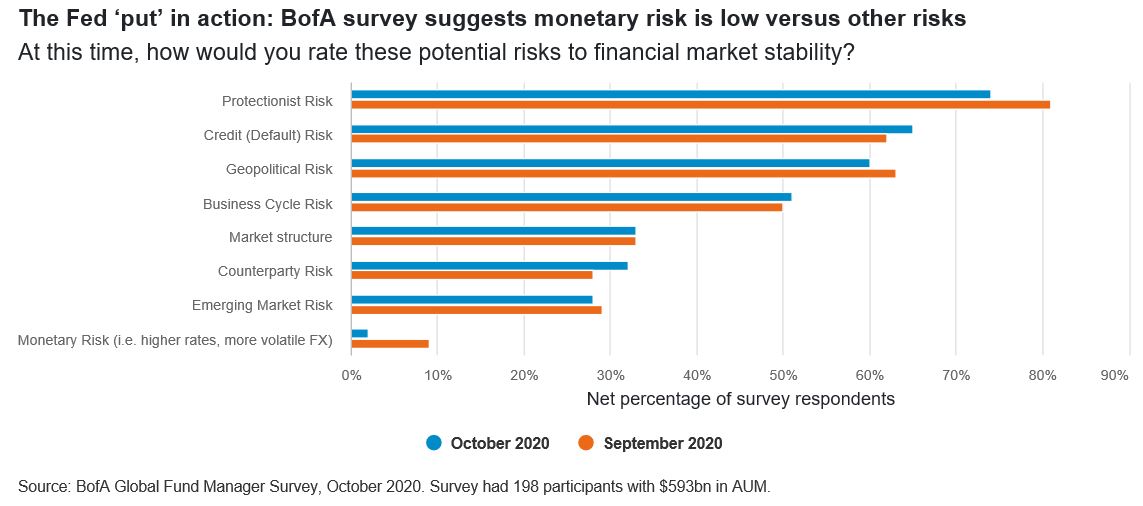
If yields do rise, whether through greater supply, signs of inflation or improving growth, we expect the Fed to step in with further measures, maybe even yield curve control. On the equity side, the concept of the Fed ‘put’ is becoming a reality as more central banks from Japan to Switzerland buy assets further up the risk spectrum in an attempt to stabilise markets.
China looks more stable compared to past crises
While economies in the West are being buttressed by copious amounts of stimulus to counter the effects of the pandemic, China appears more stable by comparison. In past crises, emerging markets in Asia and elsewhere were often among the first to be sold off. This time, China’s first in, first out momentum has helped it recover more quickly, increasing the number of opportunities in some cyclical sectors like semiconductors and in areas benefiting from the government’s desire to make the Chinese economy more resilient, to have a more domestic consumer-led profile, and in some areas to ‘green’ its industrial machine.
Divergence calls for an active approach
Many factors could dictate the pathway for markets as we enter the final quarter of 2020 - most prominently, the fiscal implications of the possible outcomes of one of the most bitterly contested elections in American history. Chinese economic policy, the fallout from Brexit and the arrival of an effective vaccine against Covid-19 could also have an impact. Some sectors remain on the brink, while others are riding high on an acceleration in existing trends. This stark divergence, plus increased global uncertainty, creates conditions in which an active approach can add real value over the long term and disciplined, careful trading can help keep transaction costs low.
[1]Source: Goldman Sachs, October 2020 - $66bn is the largest amount since tracking began in January 2017.
|