The investment world’s slow awakening
No international investor can ignore Asia; it is home to some of the world’s largest markets, fastest-growing economies, largest middle classes, and most innovative companies. In short, it is full of opportunities.
Yet the investment world’s view can easily distort our perspective of the region. Asia accounts for 36 per cent of global GDP however its share in leading global market indices falls well short of that at 10.24%.1 Because these indices act as benchmarks for global investors, many may be structurally underweight the region.
What’s in a name?
Geographically, Asia’s borders may be clear but investment indices that guide portfolios can seem anything but. Should China be treated as a stand-alone market or the beating heart of Asia? Should Asia be regarded as an emerging markets region? How about Korea, Taiwan, Hong Kong, or Singapore? Is it ASEAN that we’re looking for when we equate Asia with growth?
How an allocation to Asia or a benchmark is designed has a material impact on the performance and characteristics of any portfolio. Leading Asian benchmark indices combine very different sets of countries despite only marginally different labels; it goes without saying that their market exposures suit different investor profiles.
Nor is it easy to choose between the bewildering number of stocks in Asia and the type of stocks different indices offer exposure to. Standard country indices typically include only mid and large-cap companies, which are generally much more exposed to global markets than small-cap companies. This means that choosing standard indices can raise correlations in portfolios and not provide the local exposure that an Asia allocation in a global portfolio is expected to deliver.
For example, South Korea’s Kospi index, home to some truly global technology giants, has a correlation of 0.72 to the S&P 500. For the country’s more domestically exposed small-cap index, the Kosdaq, that correlation is 0.61.2
These considerations are an additional dimension of any allocation strategy: in addition to choosing which country or countries you want exposure to, moving up or down the cap scale in individual countries can help to fine-tune a portfolio’s outcome.
Perceptions can be misleading
Although Asia remains a collection of countries at very different stages of economic development, it has changed tremendously over recent decades. Not surprisingly, so have investment conditions, but global investor perceptions can be slow to catch up.
Twenty years ago, Chinese stocks (1 per cent) and Korean stocks (4 per cent) barely featured in the MSCI AC Asia ex Japan index. Now they represent more than half the index (36 and 17 per cent respectively). Singapore and Malaysia were a quarter of the index then; now their share is less than 7 per cent.
Graph 1: Country shifts - economic growth in China and Korea has propelled both to the top slots
.png)
Source: MSCI, Bloomberg, Fidelity International, June 2018. MCSI AC Asia ex Japan Index (MXASJ Index) geographical composition. 1998 data as of 30 June 1998, 2018 data based on latest MSCI fact sheets for May 2018.
And that’s not all. Asian indices now have a completely different composition to 20 years ago, with exposure to sectors well beyond traditional raw materials or basic manufacturing industries. Strikingly, and contrary to many investors’ assumptions, it is not the US market that has the highest exposure to technology, but emerging Asia - and by some margin. Information technology accounts for 32 per cent of the MSCI AC Asia ex Japan index, but only 26 per cent of the MSCI US index. The combined share of materials, industrials, energy, and utilities stocks in the MSCI AC Asia ex Japan index has halved in the past twenty years, from 37% to 19%.
Tellingly, the region’s largest stocks are all in 21st century industries, and leaders in their field. Six out of the ten largest stocks in the MSCI AC Asia ex Japan index are IT or telecommunications businesses (and the remainder are financials). China’s internet giants Tencent, Alibaba, and Baidu have yet to celebrate their 20th birthdays but have grown as fast as, and innovated faster than, their western counterparts.
Graph 2: Sector shifts - technology is now the leading sector in Asia
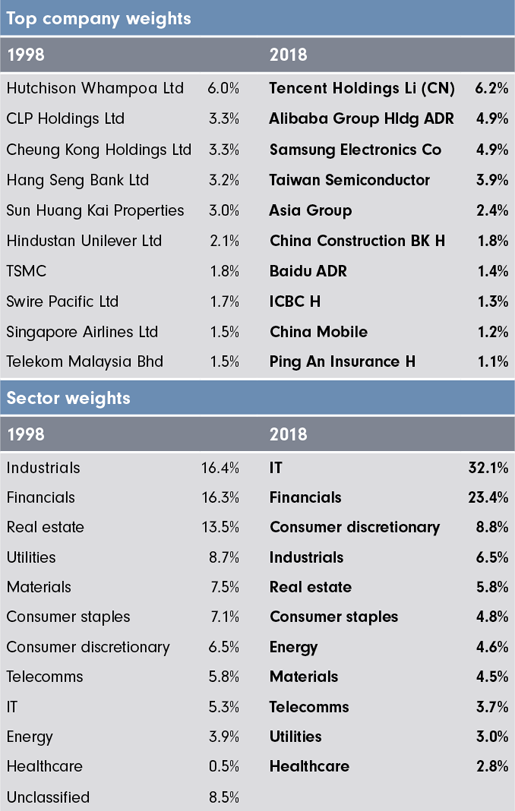
Source: MSCI, Bloomberg, Fidelity International, June 2018. MCSI AC Asia ex Japan Index (MXASJ Index) top 10 holdings by market capitalisation and sector weights. 1998 data as of 30 June 1998, 2018 data based on latest MSCI fact sheets for May 2018.
Investing in this technology exposure is much more than a play on global growth or on the potential of export-driven economies. The Asian technology sector’s explosive growth mirrors the ascent of an enormous middle class across the region. Demographics are good, average incomes have soared in the last half century, and poverty rates have fallen dramatically. For investors, technology is an excellent way to capture that growth in consumption. In addition, it can act as a defensive allocation at a time when global markets appear to be reaching cyclical peaks, with decent earnings visibility and growth forecast to continue.
China’s anchor
Traditionally, four factors helped to explain the outlook for Asian markets: China’s growth, commodity prices (as most countries are oil importers), movements in the US dollar, and global interest rates. All of these remain relevant, but China’s fortunes have taken on much more significance on the back of strong growth in intra-Asian trade. Getting the bet wrong on China is very likely to undermine an investor’s wider Asia performance.
Even though the region is much better understood now than a few decades ago, China remains an enigma for many. Investors from outside the country have very different perceptions to those within. Misunderstandings can put many off engaging at all. International investors underestimate the extent of change in China’s economy, often do not understand the country’s dirigiste governance system, and do not appreciate that most local investors are more comfortable with the current state of the affairs and the progress made in the last few years.
Younger Chinese investors’ attitudes are also changing. Traditionally, personal savings were invested in property but younger investors increasingly feel the need to diversify into stock and bond markets and precious metals. Over time, this will deepen these markets in China, and as Chinese investors venture outside their country their savings could become a significant source of funding for other markets.
It is true that it is historically unusual for a country (let alone one of China’s size) to grow so rapidly without it derailing. The high debt levels among inefficient state-owned enterprises could yet culminate in a debt or external crisis. Our analysts, along with most others, do not think this likely but it cannot be excluded. Additionally, China’s demographics are unusual for an emerging market. Because the working age population will fall in coming years, development in automation, robotics and artificial intelligence may well speed up. These are areas where many Chinese companies are already taking the lead globally.
Governance and political risks have led many smaller institutional investors, and particularly smaller pension funds, to underweight emerging markets and Asia significantly. Their concerns around leverage and non-performing loans in China, and shareholder rights, are not unreasonable, but with Asia’s, and especially China’s, increasing integration into global markets, their allocations to these markets will look even less sensible and are likely to be raised. As Chinese securities are increasingly included in both bond and equity indices, passive fund flows into mainland markets will inevitably follow.
Adding timing and tactics to structural exposure
Global or Asian managers who were less sceptical about China, buying into the structural growth opportunities and the rapid development of the technology market in particular, have done well since 2016. It is possible valuations are now extended, even if these are impressive companies with enormous longer-term potential. But very few observers expect China’s economic path to end in tears in the near future - the hard landing it has managed to avoid for years - and most think the risks in the system, if real, remain manageable. In other words, it may be fundamentally risky to ignore the country’s potential but tactically not the right time to increase China allocations, in much the same way investors view the global technology market.
Global growth data also raises a few questions. Although growth remains healthy, momentum appears to have peaked with China and the US both tightening monetary policy and global trade starting to soften. But if Chinese growth does slow more and commodity demand eases - another real concern among investors - it may not be its Asian partners who are worst hit. Instead countries like Brazil or South Africa, whose trade with China is concentrated in the natural resource sector, could suffer.
Countries like Indonesia and India have their own internal growth dynamics that are less dependent on China. India’s Prime Minister, Narendra Modi, has pushed through significant structural reforms including demonetarisation that will support future growth and create investment opportunities, once the dust of any temporary displacement settles.
Finally, the 1997 financial crisis has left companies, governments, and central banks very much aware of the risks of gearing. Emerging Asian central banks have pursued relatively cautious monetary policies in the years since the crisis. Companies have largely invested conservatively and corporate balance sheets are generally less leveraged than in other emerging markets. As a result, these economies are more resilient, with lower indebtedness and higher growth potential, and are seeing more incremental improvement than many other emerging markets. This translates into longer-term investment opportunities.
The 1997 crisis also showed up the region’s dependence on the US dollar, which is still often cited as a key risk factor without much further explanation. Dollar strength, higher US yields, and the Fed’s withdrawal of liquidity have indeed created a more challenging environment this year. However, the region is now fundamentally much less dependent on the dollar than in 1997 or even two years ago during the China growth scare. Indeed, China has emerged as the region’s anchor, providing it with a welcome degree of stability. The renminbi is not managed against the US dollar but a basket of currencies, which many investors do not fully realise. Compared against the Korean won, for example, it has been essentially flat.
Chinese local-currency bonds have provided an alternative source of returns that have a low correlation with global bond markets. They have performed well for investors who were keen to raise their exposure to this part of the world. Nonetheless, international investors also have to consider the currency risk, which can swamp the volatility of bond positions. Investors in Chinese bonds can hedge their positions directly, but this can be costly. They can also hedge indirectly, using a basket of currencies that are relatively stable against the renminbi because of its anchor function in the region, which is cheaper.
Rethinking allocations
Asia is home to the world’s largest consumer base, already generates a third of global economic activity, has stronger defensive characteristics and more growth potential than many other emerging markets, and is leapfrogging technological development in other regions.
The time for viewing Asia as a single block has gone. In its place is a rich, diverse, and promising collection of markets integral to any global asset allocation.
What does MSCI inclusion means for Haitian?
Chinese domestic equities will be included in the MSCI global indices for the first time. In this video, Neil Gough will take you into the world of the world's biggest soy sauce manufacturer and hear directly from Zhang Xin, Haitian's Board Secretary about what this inclusion means for the company.
1 Source: MSCI, Fidelity international – Figure shown is Asian countries as a percentage of MSCI ACWI (excluding NZ, Australia and Japan) as at the 30 June 2018.
2 Bloomberg, Fidelity International, July 2018. Correlations to the S&P 500 for 2001-2018. For 1996-2018, the difference is even starker (0.02 for the Kosdaq compared to 0.68 for the Kospi) but this period includes the dotcom bubble, which skews the data massively.