The inverted yield curve and what it can tell us
At first glance, the phrase ‘inverted yield curve’ can sound daunting.
However, once you get to know what it means, and what it represents, you’re likely to find it quite useful – regardless of how you decide to invest.
First of all, what is a yield curve?
A yield curve is a line that plots the yields of bonds with equal credit quality, at a given point in time.
A ‘normal’ yield curve slopes upwards, from left to right, with shorter-term bonds on the left, and longer-term bonds on the right.
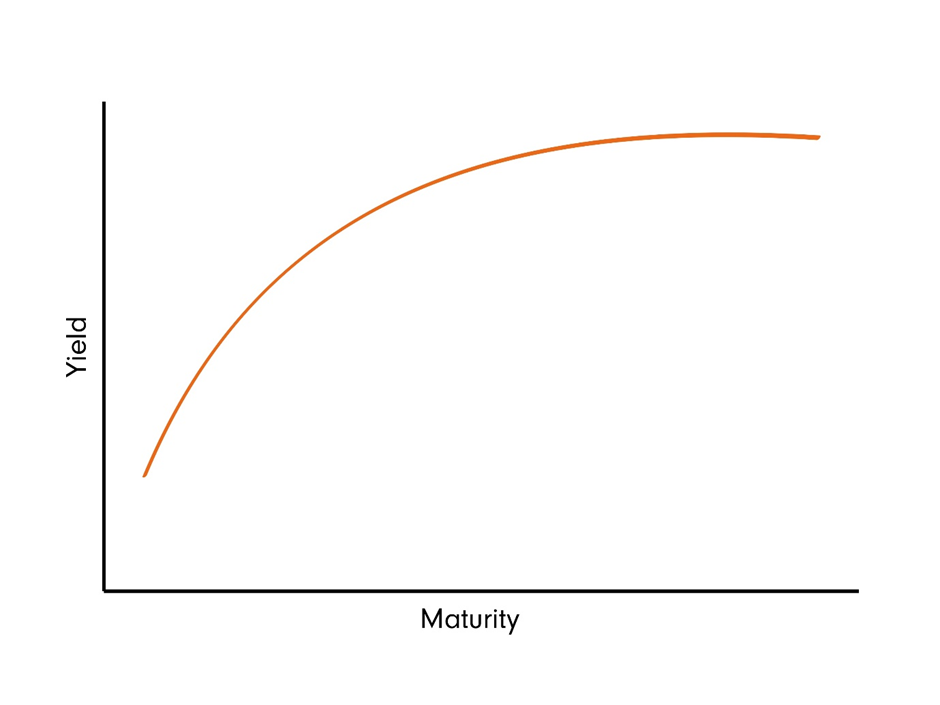
The reason a normal yield curve takes this shape is that investors usually expect to receive a higher return to compensate them for the risk of lending money for a longer period.
The US yield curve is the one most commonly referred to by investors, which compares three-month, two-year, five-year, 10-year and 30-year US Treasury bonds. This curve forms the basis for most comparisons within bond markets.
What does the yield curve tell us about the economy?
Many see the yield curve as a reliable indicator of future economic performance, due to the interdependent nature of bond prices, bond yields and interest rates.
It’s the shape (or slope) of the yield curve that investors watch closely.
For instance, a normal shape (as seen in the chart above) is most commonly associated with economic expansion, with investors expecting interest rates and inflation to rise in the future.
However, the shape of the yield curve can change - and, in some cases, invert.
Why does a yield curve ‘invert’?
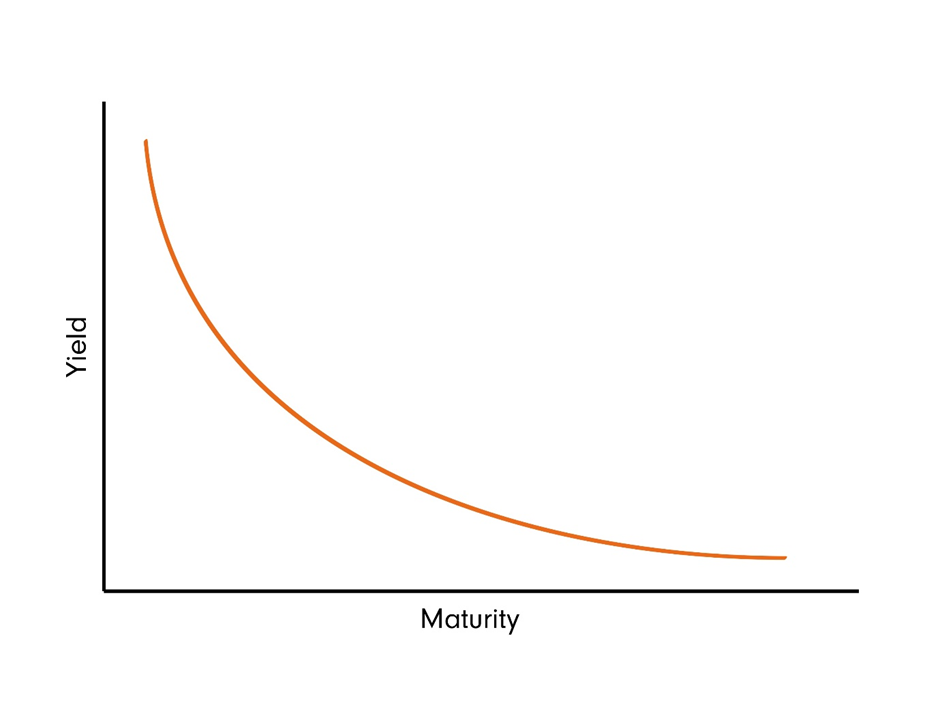
If the yield curve starts to flatten, it implies that investors are expecting a slower pace of inflation and weaker economic growth in the future.
In this scenario, the yield of longer-dated bonds will fall, and the yield of shorter-dated bonds will start to rise.
If this trend continues, the yield curve can then invert, which means short-dated bonds will offer a higher yield than longer-dated bonds.
If you see an inverted yield curve, you might want to sit up and take notice.
Why?
When the US yield curve has inverted, it has signalled a slowdown in advance of almost every US recession since World War II.
However, it’s important to remember that the yield curve reflects investors’ collective expectations – not the state of the economy right now - with research suggesting that there is an average lag of 21 months between an inverted yield curve and the beginning of a recession*.
Sometimes, this lag can widen to as much as three years. So although an inverted yield curve should be a clear indication to investors, it doesn’t necessarily mean that there’s going to be an immediate downturn in the US economy.
How should investors react to an inverted yield curve?
As we’ve outlined, an inverted yield curve could signal a slowdown in US economic growth, meaning lower inflation and likely cuts to interest rates.
If you read that the yield curve has inverted, it might be worth consulting a professional financial adviser to discuss how your assets are invested.
You might also want to think about altering your asset allocation to include other asset classes that could be less impacted by movements in interest rates.
Want more to read and watch?
Explore our other fixed income articles