What is the VIX?
The Chicago Board Options Exchange Volatility Index, or the ‘VIX’ as it is better known, is a measure of the expected volatility of the US stock market.
The VIX is based on the option prices of the S&P 500 Index and is calculated by combining the weighted prices of the index’s put1 and call2 options for the next 30 days.
The VIX is designed to reflect investors’ view of future US stock market volatility -- in other words, how much investors think the S&P 500 Index will fluctuate in the next 30 days.
Often referred to as the market's ‘fear gauge’, the VIX is used by investors to measure market risk, fear and stress, before they make investment decisions.
What does the VIX measure?
The VIX is forward-looking and seeks to predict the variability of future market movements. This is the opposite of ‘actual’ volatility, which measures the variability of prices that we already know.
The fact that the VIX represents forward-looking or historical volatility is important, as it is based on how much investors are willing to pay for the right to buy or sell a stock (call or put options).
The premium for an option can be used to represent the perceived level of risk in the market - the greater the perceived market risk, the more investors are willing to pay for ‘insurance’ in the form of options.
When investors anticipate large upswings or downswings in stock prices, they often look to reduce risk by using options to ‘hedge’ their positions. Hedging is a form of insurance, which involves an investor taking an opposite position in a stock to the one they hold, through buying an option.
So an overall increase in option prices -- indicating heightened market uncertainty and higher expected volatility -- will cause the VIX to rise, signalling to investors that market volatility is likely to increase.
What can investors learn from the VIX?
When there is a spike in the VIX, this means traders in the S&P 500 options market expect that market volatility will increase.
The higher the VIX Index, the higher the fear, which, according to market contrarians, is considered a buy signal.
Of course, the reverse is also true. The lower the VIX, the lower the fear, which indicates a more complacent market.
Chart 1: The link between the S&P 500 and the VIX
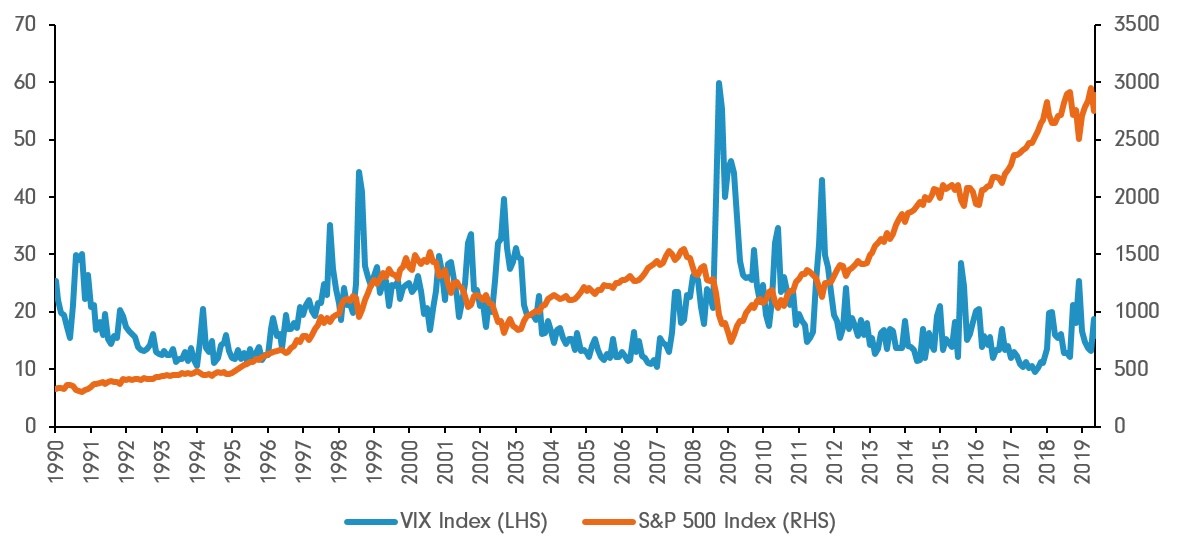
Source: Fidelity International, 2019.
In general, VIX values of greater than 30 are considered to signal heightened volatility from increased uncertainty, risk and investor fear. VIX values below 20 generally correspond to more stable, less stressful periods in the markets.
Although VIX levels can be very high during times of crisis -- you can look at 2008 on Chart 1 as an example -- extreme levels are rarely sustained for long periods of time.
1A put option gives the purchaser the right -- but not the obligation -- to sell a security for a specified price at a certain time.
2A call option gives the purchaser the right -- but not the obligation -- to buy a security for a specified price at a certain time.
If you would like to learn more, explore our other articles, videos and infographics about investing through volatility.