The equity market sell-off during the middle of 2024 was a historical oddity with a rapid rotation out of growth equities into other market segments, such as value stocks, small and medium-cap companies1. Against this backdrop, we assess the implications for a potential shift from mega-cap growth stocks towards small and mid-cap stocks (SMIDs) and highlight the potential diversification benefits from gaining exposure to a broader basket of global equities.
In the two years running into the middle of the year, market breadth was narrower than the long-term average, led by mega-caps. While we have since seen some broadening of the rally, if the market’s circle of life continues to move as anticipated, there is still opportunity for further widening to occur.
The popularity of index funds has possibly contributed to some of this market concentration, given that the ‘Magnificent 7’ technology stocks comprised about 31 per cent of the S&P 500 index at the end of August 20242. SMIDs are a relatively under-owned area that could benefit from this market broadening.
The following chart illustrates how, in 2023, only 27 per cent of S&P 500 stocks outperformed the index – a sign that relatively few individual names were driving performance.
Percentage of the S&P 500 companies outperforming the index, by year
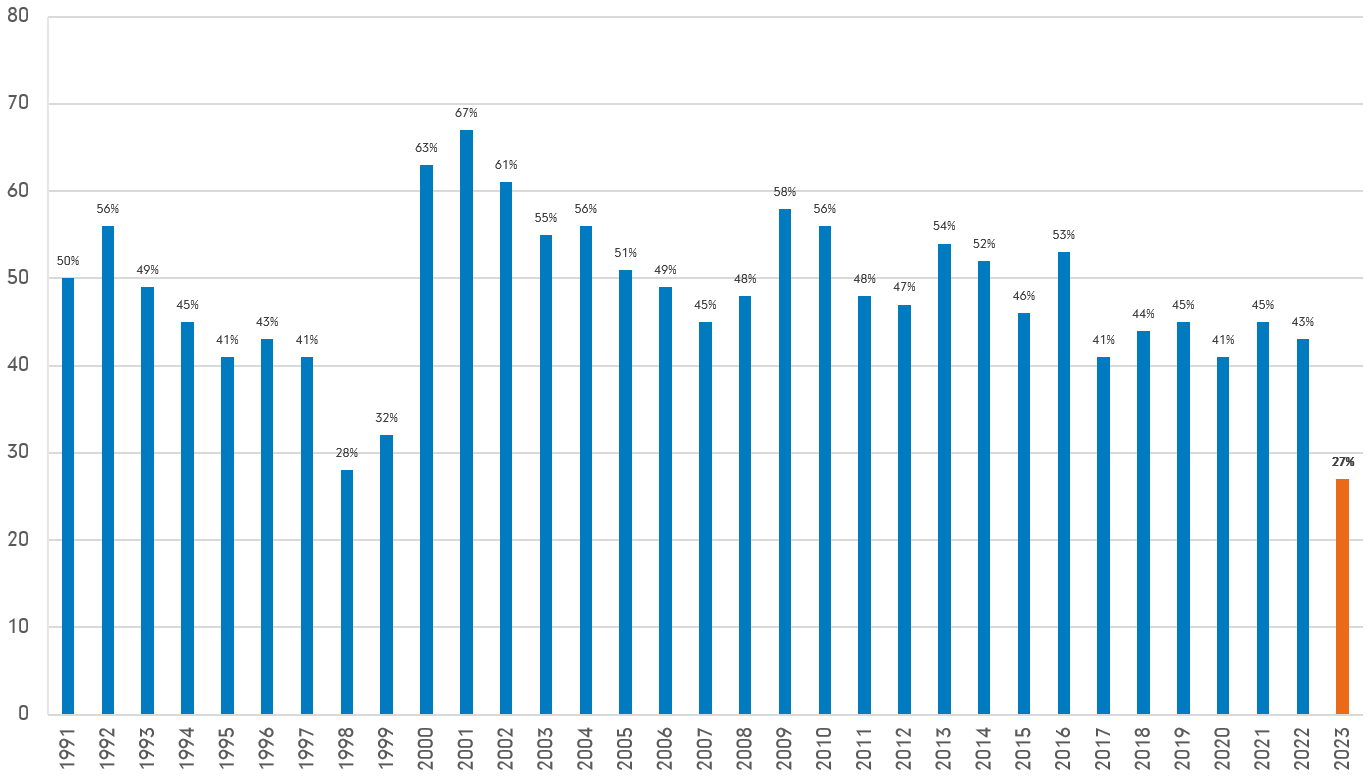
Source: S&P Global, Bloomberg, 31st December 2023. Recreated chart. It shows the % of S&P 500 companies outperforming the S&P 500 index in each calendar year. Past performance is not a reliable indicator of future results. Investors should note that the views expressed may no longer be current and have already been acted upon by Fidelity.
Furthermore, equity markets tend to do well when the US Federal Reserve (Fed) starts to reduce interest rates, illustrated by the dark blue line in the chart below. This means there is the potential for share prices to continue strengthening as the rate-cutting cycle gets underway. In a falling rate environment, areas outside larger, growth-oriented names like value and non-large cap stocks can potentially do better.
S&P 500 share prices strengthening in easing cycles

Source: Fidelity International, Bloomberg, July 2024. Measured until end of easing cycle or 12 month following 1st ease. Past performance is not a reliable indicator of future results. Investors should note that the views presented may no longer be current and may have already been acted upon by Fidelity.
Positive valuation and earnings outlooks
The valuations between SMIDs compared to large-caps have converged below long-term historical averages. This indicates upside and room for SMIDs valuations to catch up – as shown in the chart comparing the price-to-book ratio of small-caps (Russell 2000 versus S&P 500 in blue line), and small-mid-caps (Russell 2500 versus S&P 500 in orange line) with the S&P 500 index.
Forward price-to-book ratio: small and small-mid-caps vs large caps
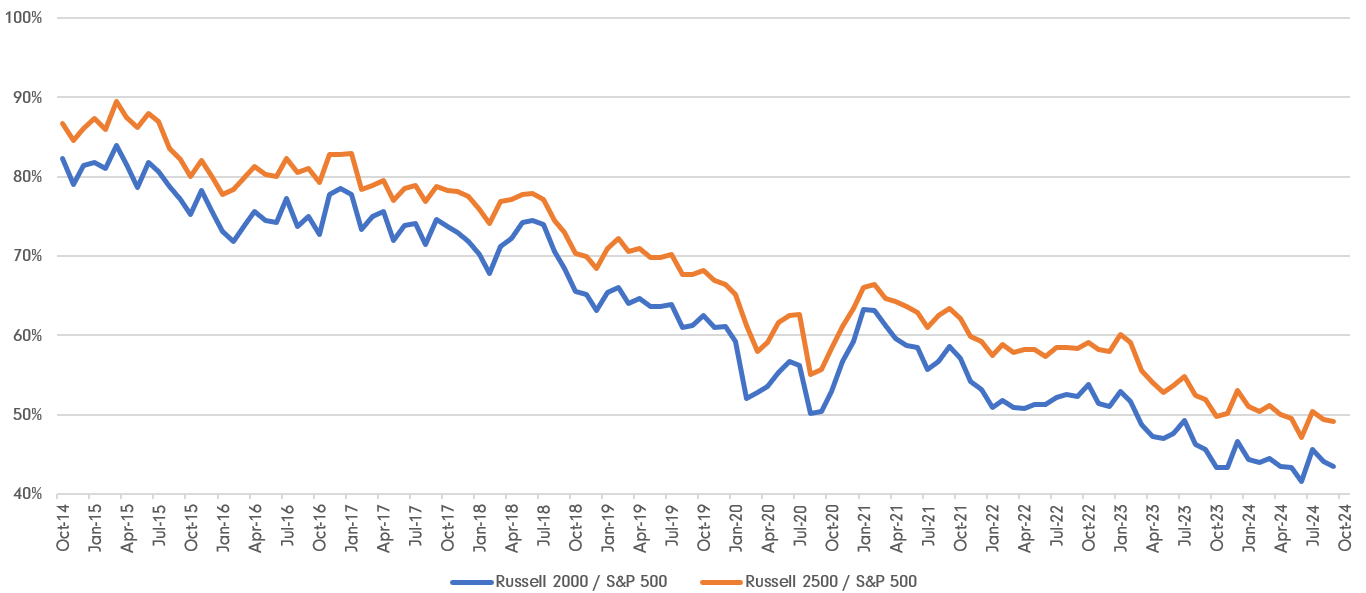
Source: Bloomberg, Fidelity International, data as of 30th September 2024. Past performance is not a reliable indicator of future results. Investors should note that the views presented may no longer be current and may have already been acted upon by Fidelity.
Historically, the Russell 2000 has outperformed large-caps after the first rate cut.
Small outperformed large caps 70.6% of the time after the first rate cut – 1954 to present
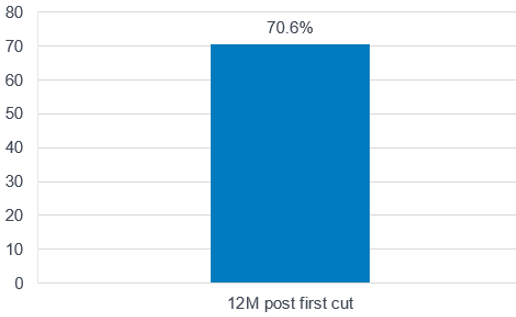
Past performance is no guarantee of future results. Analysis based on the S&P 500 and Russell 2000l. All data gathered and analysed monthly from July 1951 to June 2024. Source: Haver Analytics and Fidelity Investments, as of 30th June 2024.
Lower interest rates should help reduce debt costs
One of the challenges SMIDs (especially small caps) face is the ‘debt wall’ that’s looming over the next five years. However, as we move into a more certain interest-rate-cutting cycle, SMIDs will be able to refinance their debt. This should help bring expenses down and boost earnings.
Small caps have a relatively bigger share of debt coming due in the next five years

Source: Bloomberg, August 2024. Share of debt coming due, Russell 2000 vs S&P 500. Past performance is not a reliable indicator of future results. Investors should note that the views presented may no longer be current and may have already been acted upon by Fidelity.
Investors may seek to diversify outside the US
The strong historical performance of the Magnificent 7 means some investors may be overly concentrated in the US, growth stocks and mega-caps. Looking at other global opportunities may provide valuable diversification benefits. For example, many tech companies are truly global, hence where they are domiciled is arguably less critical than in previous years.
Against a backdrop of solid fundamentals and the commencement of rate-cutting by the European Central Bank, stocks in European staples, for instance, are currently more attractively priced than their equivalents in the US3. It’s also worth underlining that
Europe has many attractive companies, many of which have global presence. Furthermore, these firms' revenues are often widely dispersed, making them an appealing way to obtain exposure to expanding markets, such as India and China.
Meanwhile, the prospects for the UK stock market are healthier than in recent years. Inexpensive valuations and an appealing market mix of growth and income stocks offer attractive options.
Investors have overlooked Asia for some time now. Yet, earnings growth is robust, and the region’s stocks are expected to be supported by various structural trends: Inflation is presenting less of a challenge in Asia, which means there is scope to begin cutting interest rates. Aiding this process is a fundamental backdrop marked by lower corporate and consumer borrowing, healthier current-account balances, higher foreign-exchange reserves and less US-dollar-denominated debt.
There are tentative signs of recovery in China, especially in areas like exports and manufacturing. Recent policy easing measures can potentially further support the recovery. Also, Chinese companies are focusing more on shareholder returns by improving dividend payouts and share buyback schemes.
Earnings growing strongly for non-mega-cap stocks
Another catalyst that might drive a widening of market breadth is earnings. Recent earnings for non-mega-cap names have been robust, with many on track to deliver their first profit growth since the fourth quarter of 2022. Conversely, the pace of earnings growth among mega-caps has declined compared to its previous elevated pace4.
Indeed, the broader earnings outlook looks brightening. A gauge created by Bloomberg Intelligence (BI) that measures earnings guidance momentum by looking at the ratio of increased versus reduced earnings guidance reveals that earnings are expected to be positive in the July-to-September period (for the first time since 2021)5.
Earnings look positive
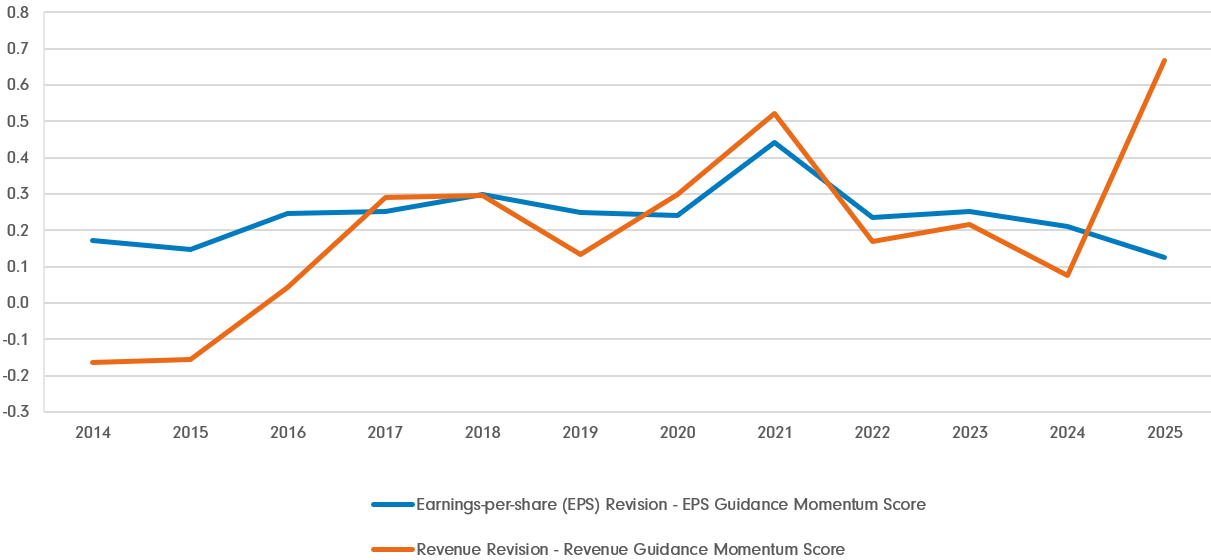
Source: Bloomberg Intelligence (BI), August 2024, earnings-per-share (EPS) Guidance Momentum Score vs Revenue Guidance Momentum Score.
Dividends are an essential part of total returns
Dividend yields tend to be relatively stable through cycles, which means notional dividends should increase in line with stock prices. In an environment where growth is slowing and interest rates move lower, this yield becomes relatively more attractive.
Dividends yields tend to be relatively stable through cycles and more valuable as interest rates fall
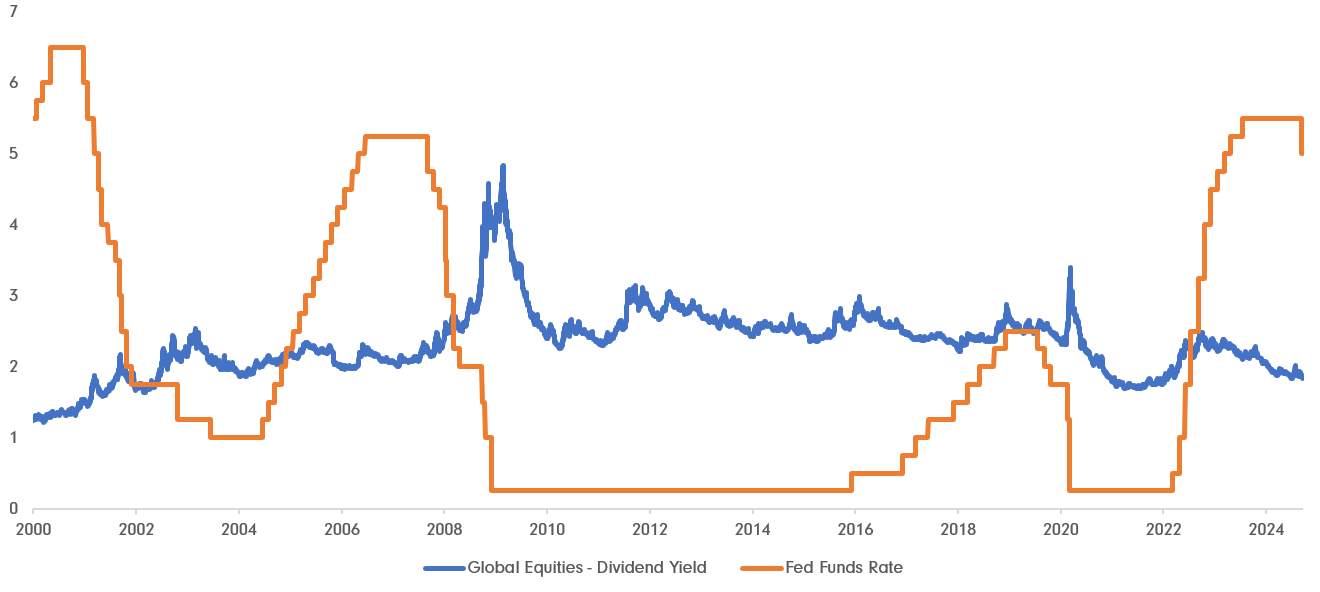
Source: Fidelity International, Bloomberg, data as of 30th September 2024. Global equities refers to MSCI All Country World Index. Past Performance is not indicative of future results. Investors should note that the views expressed may no longer be current and may have already been acted upon by Fidelity.
Dividends have proven to be important parts of total returns, especially during periods of market volatility where income received can dampen the impact of short-term price movements.
Dividends are an important part of total returns, offsetting short term volatility of price returns across market cycles
Returns breakdown: MSCI All Country World Index
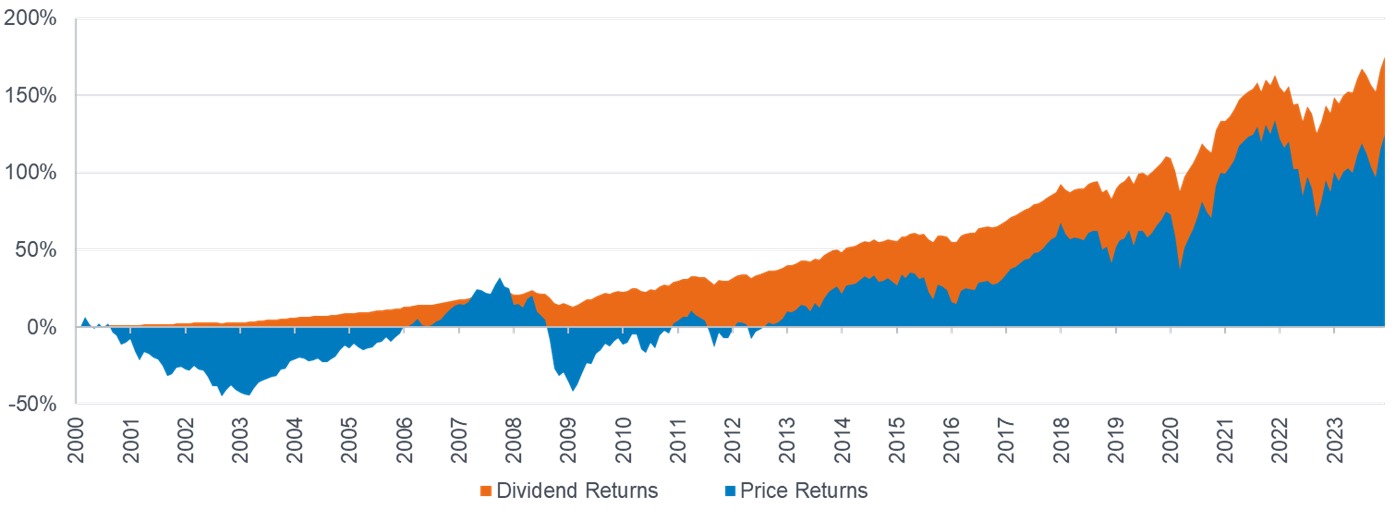
Source: Fidelity International, Bloomberg, data as of 31st December 2023. Past performance is not indicative of future results.
Look beyond the obvious even in popular sectors
While tech stocks have dominated the spotlight over the last two years, there are other parts in the global tech universe that investors should not overlook. The recent rally, largely driven by a select group of artificial intelligence (AI)-centric mega-caps, has overshadowed a myriad of sectors within the tech market that could offer opportunities.
Data infrastructure and IT consulting companies are pivotal players in the AI value chain but have often been underappreciated. Investors are also under-pricing the long-term potential of software stocks’ ability to monetise AI functionality.
The market’s fixation on mega-caps tech stocks has also neglected small and mid-cap ones, making some of them attractive for potential merger and acquisition (M&A) targets. Traditional sectors like industrials are harnessing technology to enhance internal operations and customer outcomes. The market, however, has yet to factor in this tech-driven transformation, presenting an opportunity for diversified investment.
A bias towards value sectors in a softening economy
During the last 10 years, looking at the 10 worst months for growth equities, stocks in value sectors, such as energy, financials, consumer staples, and industrials, outperformed the broader market. This is because many higher-dividend-paying stocks tend to be associated with more mature, stable companies.
However, this does not necessarily mean that value and defensive names are dull and lack structural tailwinds. For instance, healthcare is one of the most innovative market segments. Highlights include advances in AI and deep learning that enable the early detection of some cancers. In utilities, the amount of energy required to perform a ChatGPT search is up to 10 times more than a conventional Google search, which will increase the revenues of power companies.
Sector and factor mean relative returns when growth stocks have underperformed
| Sector | Relative Return* | Factor | Relative Return* |
|---|---|---|---|
| Energy | 8.45% | Dividend Yield | 2.84% |
| Financials | 3.31% | Value | 1.81% |
| Consumer Staples | 2.98% | Low Volatility | 0.82% |
| Industrials | 2.06% | Quality | 0.33% |
| Utilities | 2.03% | ||
| Materials | 2.01% | ||
| Real Estate | 1.14% | ||
| Healthcare | 0.94% |
Source: Morningstar and Fidelity Investments, as of 6th August 2024. Sector and factor mean relative returns when growth stocks have underperformed. Data analysed in the worst-performing 10 months for the Russell 1000 Growth Index vs. the Russell 1000 over the past 10 years. *Denotes that the relative return is the average over the 10 worst months.
Time for diversification
When all the aforementioned factors are combined, the world outside mega-caps offers compelling value to investors. Global, small and mid-cap names could be well-positioned to benefit in the rate-cutting cycle. Dividend stocks supported by solid earnings and valuations may also provide sustainable, inflation-resilient total returns not only in the US but also in Europe, the UK and Asia. Even within popular sectors like technology, there are opportunities outside the crowded thematic, mega-cap areas.
“When investing in the stock market, investors should always diversify by owning different kinds of funds and having exposure to investing various styles, such as growth and value, as well as small and large companies”, says Peter Lynch, former portfolio manager at Fidelity Investments.
Growth equities and the US equity market have become over-concentrated. While maintaining exposure to market growth, investors may also consider diversifying their portfolios across regions, sectors and the broader equity universe to help manage risk amid potentially uncertain times.
Sources
1 Morningstar and Fidelity Investments, as of 6th August 2024. Growth stocks measured by the Russell 1000® Growth Index. Growth measured relative to the broad-market Russell 1000® Index. Analysis involves ranking the 10 worst months of relative returns for growth stocks from July 2014 to July 2024.
2 Fidelity International, Fidelity Investments, August 2024.
3 Europe's Magnificent 7 Stocks Are Profitable - And Cheaper
4, 5 Earnings Growth in US Finally Showing Up Outside Tech Megacaps
