Key points
-
Emerging markets offer the potential for stronger growth compared to developed markets, despite the added volatility.
-
The younger economies and populations in emerging markets suggest faster economic growth and potentially better market returns. The recent weakening of the US dollar has also been beneficial for these markets.
-
Emerging markets are relatively cheaper in terms of price-to-earnings ratios compared to the US and Europe.
Investors who have built a balanced portfolio might consider adding emerging markets (EM) funds. They come with added volatility but offer the opportunity for stronger growth than developed markets.
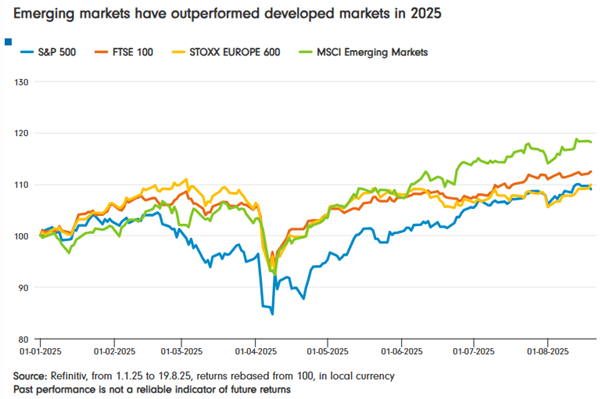
In 2025, EMs are certainly beating major market counterparts. The MSCI Emerging Markets index has risen 18.1% so far this year, ahead of the FTSE 100’s 12.4% rise, Europe’s 9.8% and a 9.0% increase in the S&P 500 (figures to 20 August). Please remember past performance is not a reliable indicator of future returns.

However, EM has been less impressive in recent years. The table below shows the performance of EM compared to a global index. Performance was particularly weak in 2021, despite it being a strong year for most markets during the post-Covid recovery. China was a particular drag that year, due to concerns about heavily indebted companies and consumers.
Calendar year returns: Global vs. emerging markets
| Market | 2020 | 2021 | 2022 | 2023 | 2024 |
| Emerging markets | 15% | -1.3% | -9.6% | -1.3% | 15.2% |
| Global | 13.2% | 20.1% | -7.6% | 10.6% | 19.3% |
Source: Refinitiv, from 1.1.20 to 31.12.24, based on MSCI Emerging Markets Index and the FTSE 100. Past performance is not a reliable indicator of future returns.
Reasons for optimism
The long-term story is that the younger economies and populations of emerging markets translate to faster growing economic growth and, potentially, better market returns. This is far from certain, but it is enticing for investors who need long-term growth and are comfortable with additional risk.
The falling US dollar is helpful to emerging markets and helped power the recent rally. A weaker US dollar reduces the cost of servicing dollar-denominated debt, which many EM countries hold, and encourages money into non-US dollar assets. It also provides a boost to commodity prices which helps many emerging markets.
In the past, investors often worried about emerging market debts. But the situation today is very different from the 2010s. Today, debts are as big a problem in the developed world.
Reasons for caution
Emerging markets had a strong run in the 2000s but have otherwise been a disappointment to investors for much of the century, especially in contrast to a thriving US market. There have been pockets of strong performance. India has been a standout performer over the past decade, though performance has faltered so far in 2025.
The lesson is that while EM holds plenty of promise, the ride can be bumpy and is uncertain.
What is changing now?
EMs should be benefiting from a rotation of money out of the US. However, Europe has so far benefited most, possibly because investors fear a greater impact of US tariffs on emerging market countries.
This fear may be overplayed in some instances. The US, for example, accounts for just 3% of the revenues of companies included in the MSCI China index compared to 85% coming from mainland China itself. That’s very different from Taiwan with more than 40% US exposure or Korea with more than 15%.
How cheap are emerging markets?
Your entry point is key to investment success - buy when valuations are low and higher returns should eventually follow, although this is never certain.
The basic measure is to compare prices with declared earnings. EMs are on a price-to-earnings (P/E) ratio of 15, far cheaper than 28 for the US or 17 for Europe, according to analysis by Schroders (below). Although it’s important to consider today’s ratio for each with its own historic average. The table below sets out the P/E ratios for each investment region and shows in brackets the percentage above or below the 15-year average. Emerging markets are 13% more expensive than their historic average; the UK is 3% cheaper.
P/E ratio: Emerging markets vs. rest of world
| Market | P/E ratio (trailing) | CAPE | Yield |
| US | 28 (+33%) | 37 (+36%) | 1.2% |
| UK | 14 (-3%) | 16 (+15%) | 3.4% |
| Europe (excluding UK) | 17 (+1%) | 20 (+8%) | 3.0% |
| Japan | 17 (+4%) | 22 (+2%) | 2.2% |
| Emerging markets | 15 (+13%) | 15 (+8%) | 2.5% |
Source: Schroders Equity Lens. Figures to 31st July 2025. (Above or below the 15-year historic average is shown in brackets).
The second column introduces a more sophisticated version of the P/E ratio known as CAPE (the cyclically adjusted price to earnings ratio). This smooths out the ups and down of the business cycle which, its fans say, makes for a better measure. Emerging markets has the lowest (cheapest) CAPE score.
Finally, the third column shows dividend yield, with higher income hinting at better value. Emerging markets sit mid-table.
It’s important to note that wide valuations exist within emerging markets. India, for example, is arguably more expensive even than the US. But China barely trades in double digits in terms of price to earnings. Korea is on a PE ratio of just over 10.
If you are interested in investing in opportunities in emerging markets, learn more about the Fidelity Emerging Markets Fund and Active ETF (ASX:FEMX) today.
