Key takeaways
- Investors have favoured momentum over quality: over the past two years, investors have been rewarded for owning lower-quality, more volatile and more expensive businesses, while quality companies have lagged.
- Risk appetite has returned in force: highly valued, volatile and even non-profitable technology companies have significantly outperformed broader markets, highlighting investors' willingness to look beyond current fundamentals.
- History suggests maintaining perspective: today's market leadership shares several characteristics with the late-1990s dotcom period, when speculation outperformed quality before fundamentals eventually reasserted themselves.
In the most recent edition of my Market Musings, Why quality still matters, I explored the quality factor, examining both its superb long-term track record and the challenges it has faced more recently. Suffice to say, quality investing has endured a difficult period over the past 18 months.
That naturally raises the question: if quality has been struggling, what exactly has been working?
The obvious answer is anything related to the Artificial Intelligence (AI) boom. But that's a broad label. To understand what's really driving returns, we need to look beneath the surface.
Factors driving performance
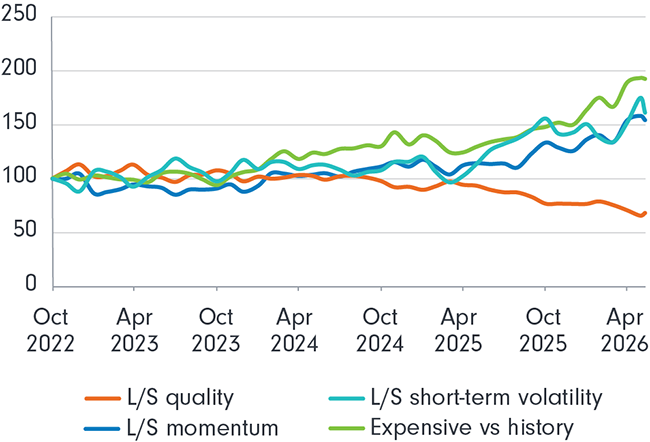
If we examine the market through a factor, or investment style, lens, the first piece of the puzzle begins to emerge. In the chart below, we look at a series of stock baskets constructed by UBS HOLT.
UBS HOLT Quant Factors
Source: UBS HOLT, Bloomberg, FIL, as at 31 May 2026.
The orange line represents the Long/Short Quality basket. This involves going long (buying) a group of high-quality companies and shorting a group of low-quality companies. This is effectively what we explored in the previous article: lower-quality companies have outperformed higher-quality companies over the last 18–24 months. Historically, this has not been a trend that has delivered superior outcomes over the long-term.
The blue line represents the Long/Short Momentum basket. This involves going long stocks exhibiting strong operational and share price momentum, while shorting stocks with weak momentum.
The green line is the Long/Short Short-Term Volatility basket. This involves going long companies exhibiting high levels of short-term (~90 days) volatility and shorting those with relatively stable share price behaviour.
Finally, we have the standout performer in yellow. This basket consists of 100 US stocks that screen as expensive relative to their own valuation histories.
Taken together, these factors paint a clear picture of what the market has been rewarding over the past two years. Put simply, investors would have been rewarded far more for owning lower-quality, expensive and highly volatile businesses than higher-quality, cheaper and less volatile ones. That is not a combination that has historically delivered superior returns over the long term.
The next chart examines the market's preferences from a different angle. Once again, we are using UBS HOLT quantitative factors to categorise stocks.
Rolling 18-Month Long/Short Return

Source: UBS HOLT, FIL, as at 31 May 2026.
The orange line denotes companies that are higher quality than the market. Once again, quality here is defined in terms of durability and longevity—companies that generate high returns on investment and sustain those returns over extended periods.
The blue line, however, represents companies experiencing significant changes in Cash Flow Return on Investment (CFROI). This factor focuses on direction and improvement. A company with relatively low returns today but experiencing substantial upgrades can score highly, even if its absolute level of profitability remains modest.
Putting today’s market into perspective
Since mid-2024, the market has increasingly rewarded change rather than quality. Companies delivering large earnings upgrades, margin expansion, operating leverage or near-term cash flow improvements have been favoured over businesses that are already highly profitable, but stable.
The last time investors showed a similar preference for short-term revisions over enduring business quality was in 2000, right before the dotcom bubble burst. That doesn't mean history is destined to repeat itself. However, it should at the very least warrant caution and raise a few warning flags that investors should continue monitoring closely.
The factor data tells us what characteristics investors have been rewarding. Looking at the market through a sector lens helps explain where those preferences are showing up most clearly.
Winning sectors
Source: Bloomberg, FIL, as at 31 May 2026.
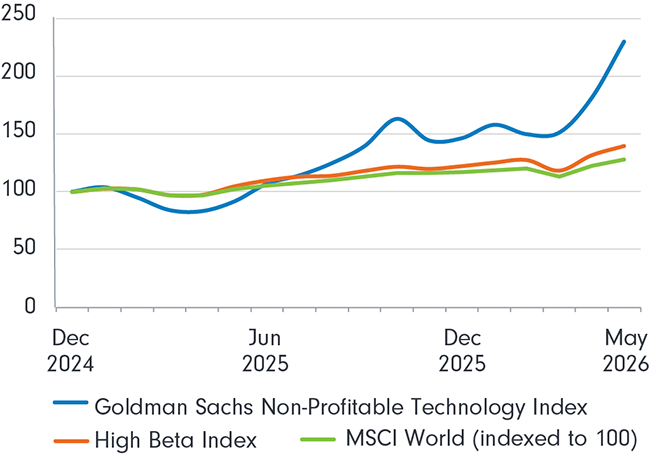
The chart above shows the MSCI World Index, indexed to a starting value of 100. Since the beginning of 2025, it has risen approximately 28%. Next, we have the “High Beta Index,” which I define as an equal-weighted basket of three higher-beta sectors: Information Technology, Financials and Industrials. This group has risen almost 40% over the same period.
However, both pale in comparison to the runaway winner: the Goldman Sachs Non-Profitable Technology Index.
This basket consists of high-growth, speculative technology companies with no or negative earnings. It serves as a useful gauge of investor risk appetite, as investing in companies that lose money is clearly not sustainable over the long term.
This collection of stocks has risen approximately 130% since the start of 2025. Once again, the message is clear:
Over the past 18 months, investors would have been better rewarded owning speculative, loss-making companies than high-quality businesses generating sustainable cash flows.
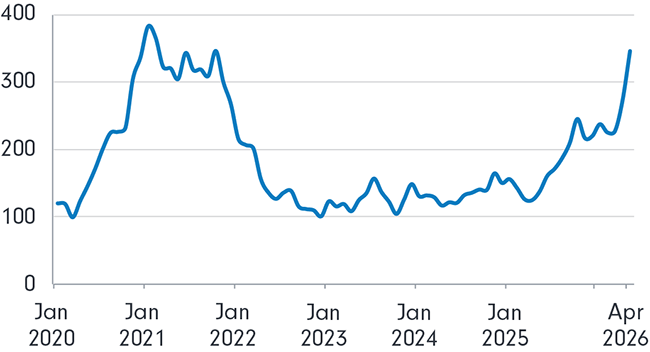
Unfortunately, we don't have a particularly long history for this index, as Goldman Sachs only launched it in 2020. Nevertheless, what the limited history does show is that it is highly volatile and extremely sensitive to both macroeconomic conditions and investor sentiment.
In 2020 and 2021, when monetary policy was exceptionally loose and capital was abundant, the index more than tripled. In contrast, during the 2022 bear market, when interest rates rose sharply, the index declined by more than 70%.
Goldman Sachs Non-Profitable Technology Index
Source: Bloomberg, FIL, as at 31 May 2026.
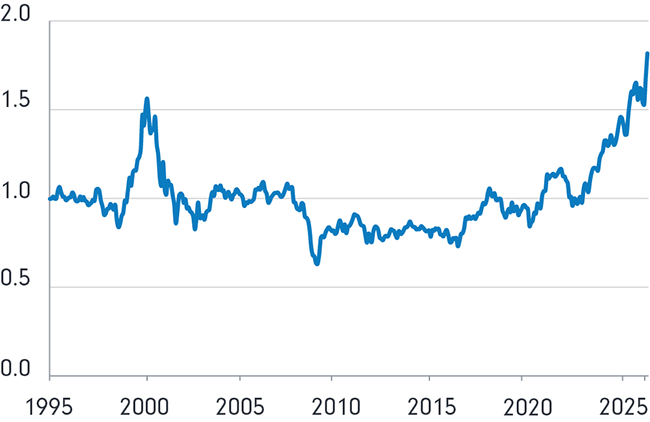
If we return to the High Beta Index, another useful way to view the market is by comparing higher-beta sectors (Information Technology, Financials and Industrials) with lower-beta sectors (Utilities, Consumer Staples and Healthcare).
If we create a High Beta/Low Beta ratio, we can observe how these two groups have behaved over time.
High Beta/Low Beta Ratio
Source: Bloomberg, FIL, as at 31 May 2026.
Once again, the data warrants attention.
With the exception of the dotcom bubble, where Information Technology drove high-beta sectors aggressively higher, this ratio has historically oscillated around one, implying a relatively balanced relationship between higher-beta and lower-beta sectors.
That balance has changed dramatically over the last two years. More notably, the ratio has now surpassed the levels reached during the dotcom era.
No one knows exactly when this cycle will end. However, many of the behaviours currently driving markets, such as investor enthusiasm for high-growth companies, a fixation on short-term upgrades, and a willingness to overlook current profitability, look strikingly similar to those seen during the dotcom era. And that movie didn’t end well.
That doesn't mean history will repeat itself. But it does suggest investors should be cautious about assuming today's market leadership is permanent.
If this cycle ultimately follows a similar path, quality investing may once again provide an important source of resilience. During the 2000–2003 downturn, the MSCI Quality Index fell 42%, compared with a 48% decline for the MSCI World Index and a 75% decline for the NASDAQ Composite.
Quality won't eliminate downside risk. But when markets eventually refocus on fundamentals, history suggests it can help provide meaningful protection. Should the ending to this movie resemble the last one, I would expect quality to once again provide investors with some insulation from market turbulence.
For long-term investors, periods like these are often the moments when quality matters most not least, because few investors are willing to pay attention to it.